#Trending: 2Q23 Space SPAC Earnings Scorecard
Multi-Quarter Trends Across Capital Management, Scaling Efficiency, and Solvency Metrics
Disclosure/Disclaimer: Case Closed should not be interpreted as investment advice or an investment recommendation; posts represent Case’s personal opinions only. Please do your own research before investing. Case owns shares of ASTS, PL, RKLB, and SPIR at the time of this post (10/2/23).

When I analyze space SPAC earnings reports, I like to use a simple “back-of-the-envelope” framework to focus on each company’s progress toward “default alive” status before I dig into previously issued guidance, analyst expectations, or management commentary.
My simplified framework was inspired by the Josh Wolfe quote “survival is a necessary precondition for growth (link),” and I originally developed it to identify which space SPACs were in a position to survive the oncoming economic “winter” and therefore might be suitable to invest in amidst a market downturn (link to August 2022 post).
Earnings Framework: Three Categories, Seven Metrics
Capital Management
The space SPACs are not cash flow positive; therefore, the most important analysis we can do is to compare each company’s available capital vs their average free cash flow burn to determine their capital runway.
Last 12mo Average Free Cash Flow (FCF) Burn: after your mother, cash is the most important thing in life. FCF represents the cash generated or burned from day-to-day operations and long-term investing, and none of the SPACs are generating FCF yet, so we want to see this metric progressing towards breakeven.
Capital Runway: capital runway is a figure I’ve made up to estimate how long a company has until it runs out of cash. Using the company’s total available capital (cash + unused debt or equity facilities) and average FCF burn, we can estimate when each SPAC might run out of available capital. We want to see this extending into the future, not move closer to the present day.
Scaling Efficiency
We must also examine which space SPACs are actually moving toward profitability. We cannot simply take management’s word that they will be profitable by X year or in Y months—let us measure if they are actually losing less money (on a relative basis) as they scale.
Revenue: none of the SPACs have grown their revenue base to the point of reaching consistent cash or profit breakeven yet, so we want to see continued quarter-over-quarter (or at least year-over-year) revenue growth.
EBITDA Margin: similar to FCF burn, we want to see this income statement proxy for profitability progressing towards breakeven.
Burn Multiple: burn multiple is an efficiency metric used with startups that have yet to reach cash generation; it measures dollars of cash burned vs dollars of revenue generated (link for more details). An efficient company has a burn multiple under 1x (meaning for every $1 of cash burned they generate more than $1 of revenue).
Solvency
If a company goes bankrupt, debtholders have priority claims on the remaining business while equity shareholders do not. While few of the SPACs have enough debt for this to be a worrisome topic, this analysis would be incomplete without looking into debt.
+ 2. Cash > Debt and Debt to Revenue: both these metrics gauge a company’s debt levels relative to its ability to pay off the debt as needed. Companies with more debt than cash and high debt-to-revenue ratios are indicative of potentially misaligned capital structures.
Multi-Quarter Earnings Trends
While Case Closed readers may be familiar with my quarterly earnings “report cards,” following 2Q23 earnings results, instead of taking a snapshot of just the quarter’s report I decided to analyze each company’s earnings trends over the last 5 quarters.
Looking at total quarterly earnings scores from 2Q22 - 2Q23, the companies at the top and bottom of this scorecard are not surprising.
What I find more interesting is looking at individual company trends within the categories of capital management, scaling efficiency, and solvency—from this point of view, there are several clear groupings…
Group 1 (Planet Labs and Rocket Lab) - Overcapitalized + Investing for the Future
Unsurprisingly, Rocket Lab and Planet Labs have the best cumulative earnings scores with perfect solvency sections and strong scaling efficiency metrics, but with mediocre capital management.
Their weakness in capital management is driven by the fact that these companies are utilizing the hundreds of millions of dollars raised in their SPAC transactions and they are heavily investing in future growth:
Rocket Lab is investing in its next-gen Neutron rocket (and has been active in the M&A market), which promises better unit economics and a larger total addressable market (TAM) than its current Electron rocket.
While RKLB’s Neutron investment is expected to accelerate through 4Q24, (which will likely bring in its capital runway from YE26), the company’s CFO has literally said “we overcapitalized ourselves to execute on Neutron,” so I expect management is comfortable with its balance sheet positioning.
However, we can never forget that “space is hard” and there’s a good chance that Neutron’s development could take longer and cost more than expected, so we can’t rule out the company needing to raise additional capital in the future. This could potentially mean dilution (vs the alternative of debt), but that is a risk space SPAC investors have to be aware of and accept.
Planet Labs is both investing in both hardware and software initiatives.
Hardware - Planet is developing 2 new satellite constellations at the same time.
Software - Planet is investing to develop a platform to make its data easier to use for partners and customers. By doing so, Planet hopes to move up the software stack from data to distribution and analytics, which have higher value and a greater total addressable market.
While returns from both these investment initiatives are still somewhat unclear, the company’s upcoming investor day (to be held on 10/10) will hopefully provide some clarity on the subject, and the company’s focus on reaching profitability within the next year combined with a capital runway through 2027 should provide comfort in Planet Labs’ capitalization.
Group 2 (Spire Global and BlackSky Space) - Solid Revenue, but Debt-Laden Earth Observation Companies; Racing to Profitability

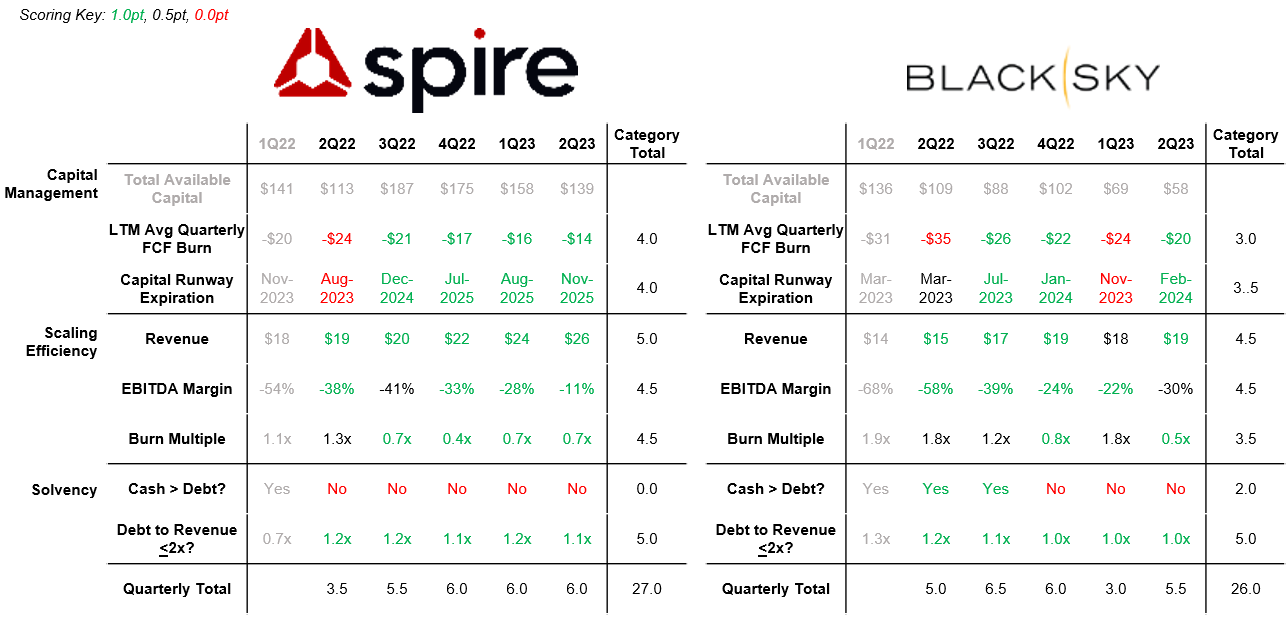
Both Spire Global and BlackSky Space show solid capital management and scaling efficiency scores, with trends moving in the right direction (though BKSY’s capital runway expiration date is a little close for my comfort).
However, both SPIR and BKSY have taken on a decent amount of debt to finance their operations. While earth observation (EO) peer Planet Labs has avoided debt entirely, legacy EO player Maxar also had a history of taking on debt to finance its operations, so this is not unprecedented for EO companies. I’m sure SPIR and BKSY were eager to tap into debt markets to utilize non-dilutive funding for their capital needs, while lenders looked at their SaaS-esque business models more favorably than other space companies and were willing to help finance their businesses. While debt utilization has helped these companies in the near-term, it is a double-edged sword; this debt creates an overhang for each company as their cash positions dwindle, and might make it harder for them to raise additional capital in the future (in addition to burdening them with interest payments and eventually needing to pay back their loans).
However, as evidence that management teams are aware of the importance of reaching cash/profit breakeven, both companies have drawn firm lines in the sand for when they plan to do so:
BlackSky has guided toward EBITDA breakeven in 4Q23
Spire Global has guided towards EBITDA breakeven in 1H24 and FCF breakeven in 2Q-3Q24
Group 3 (Redwire Space and Terran Orbital) - Manufacturing Companies Balancing Revenue Growth vs Profitability; Dilution Incoming?
Manufacturing is a difficult business—these lower margin and more capital-intensive businesses require lots of revenue to overcome fixed costs and reach profitability/cash flow breakeven. While Redwire is further along its scaling journey than Terran Orbital, both companies are still burning cash to generate revenue (for the time being).
With nearly ~2x the quarterly revenue of LLAP, RDW has excellent burn multiples and is actually the 1st and only SPAC to reach positive EBITDA. The company’s total available capital is getting low, but it should hopefully achieve FCF breakeven soon.
LLAP management expects to reach profitability by the first half of 2024 and the company is currently investing in production capabilities to satisfy existing backlog.
While I anticipate both companies diluting shareholders until they reach the revenue scales needed to become profitable (both companies have already tapped the debt markets and have unused equity facilities ready to use when needed), the long-term prospects for these companies can be viewed as appealing given their status as pick-n-shovel hardware providers for the growing space industry (though competition in both company’s area of manufacturing expertise is growing).
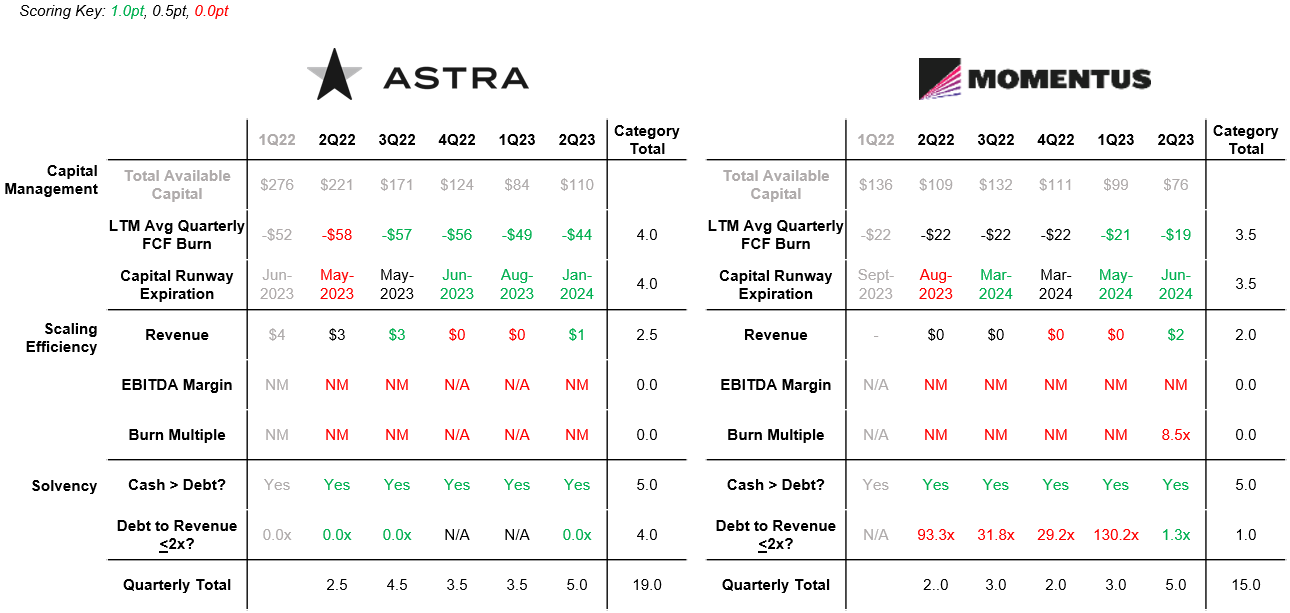
Group 4 (Astra Space and Momentus) - Tick Tock, Tick Tock…
While Astra and Momentus have been focused on reducing cash burn and extending their capital runway, their efforts are potentially too little too late (as acclaimed pop artist Jojo discussed in her hit “Too Little Too Late”), as technology readiness and lack of monetization may doom these companies before they ever get a real chance to prove that there is demand for their products and services.
Group 5 (AST SpaceMobile and Virgin Galactic) - Burning Hot, No Plans to Stop
While there are many critics of AST SpaceMobile and Virgin Galactic, institutional investors clearly believe in their respective management team’s long-term vision of the future given that each company has been able to raise hundreds of millions of dollars of additional capital since their SPAC debuts.
I don’t understand how or why SPCE has been able to raise ~$2B of capital since 2019—I question the company’s unit economics and demand for its highly-priced space tourism service, and to date the company has mostly not executed according to schedule for its development timeline. Perhaps investors believe SPCE will transition to a point-to-point space transportation company over time, expanding their TAM? Maybe I need to build a SPCE model to understand the potential ROI for this company assuming it survives to 2026 when its Delta class vehicle with supposedly solid unit economics is ready to debut.
While many question ASTS’ technology capabilities and demand/monetization of direct-to-phone service, I can actually understand the company’s ability to successfully raise capital—based on what we have seen from how the potential for LEO direct-to-phone connectivity has impacted Globalstar and Iridium’s valuation (which I have written about here and here) investors are clearly hyped over the potential size of the direct-to-phone connectivity market. AST investors have also been watching for potential go-to-market partners to help finance the company’s constellation buildout.
Both companies are burning cash quickly with no slowdown in sight as they simultaneously validate their core technology and build out the infrastructure needed to operate at scale in the future.
The net-net is that these companies aren’t expected to generate material revenue in the near-term and if their burn rates don’t begin to moderate, they may see capital runway move closer to present day vs the current 2025 expiration. Going back to the capital markets in current market conditions and as we progress into 2024 is not really something we want to have to bank on to see our investments succeed.
Conclusion
So there we have it. Some of the space SPACs are in more dramatic positions (ASTR, MNTS, BKSY, SPIR) than others (RKLB, PL), and most have some amount of dilution incoming based on their composition of available capital (i.e. cash vs untapped debt or equity; perhaps a topic for another post). Personally I found it useful to see each company’s revenue generation progression and march towards FCF/EBITDA breakeven laid out visually—I believe capital management, scaling efficiency, and solvency are important metrics to monitor so that I can recognize when one of the SPACs and/or my investments are off-track. Hopefully you found this post to be useful as well!


Thank you for that header graphic, which was perfect, and of course the analysis.
Good job!